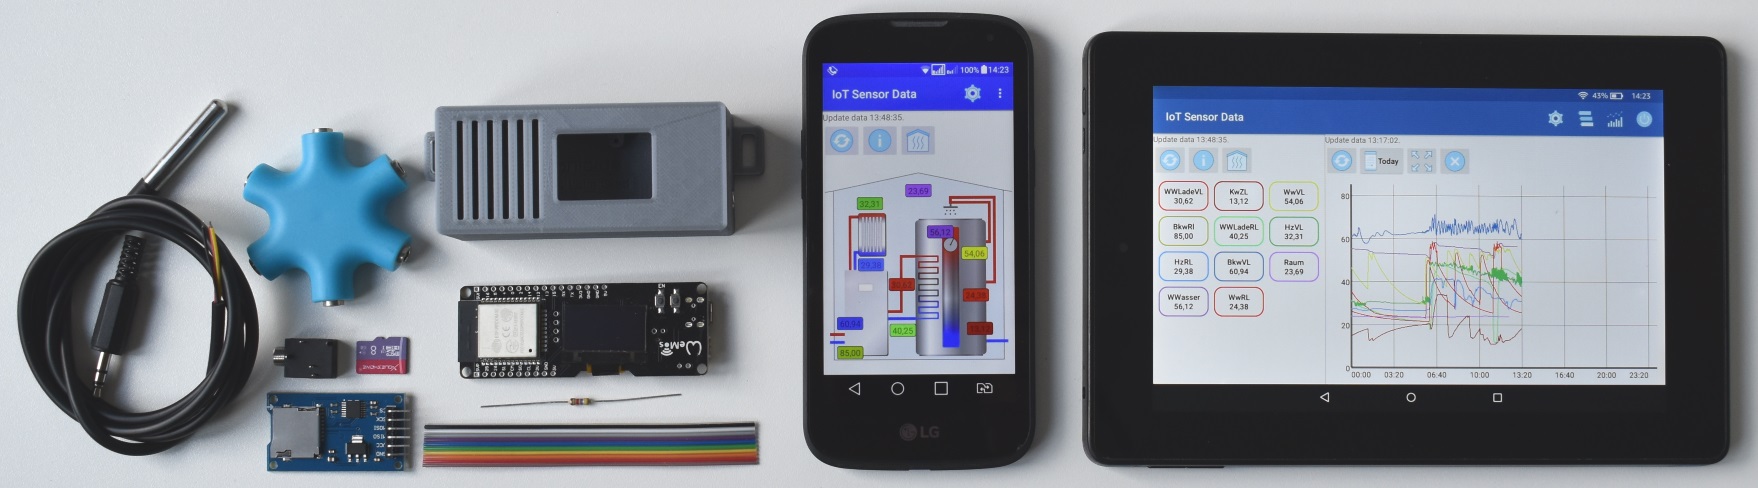
Android App – IoT Sensor Data – DS18B20
Description of the sensor logging application
With the Android app the measured temperature from e.g. the DS18B20 can be queried. The temperature gradient can be displayed and analyzed in a diagram. The app is optimized for a 7 inch tablet, but also works with a mobile phone or 10 inch tablet. The app can also be used for your own sensor logging project. The http interface of this application is described on this page.
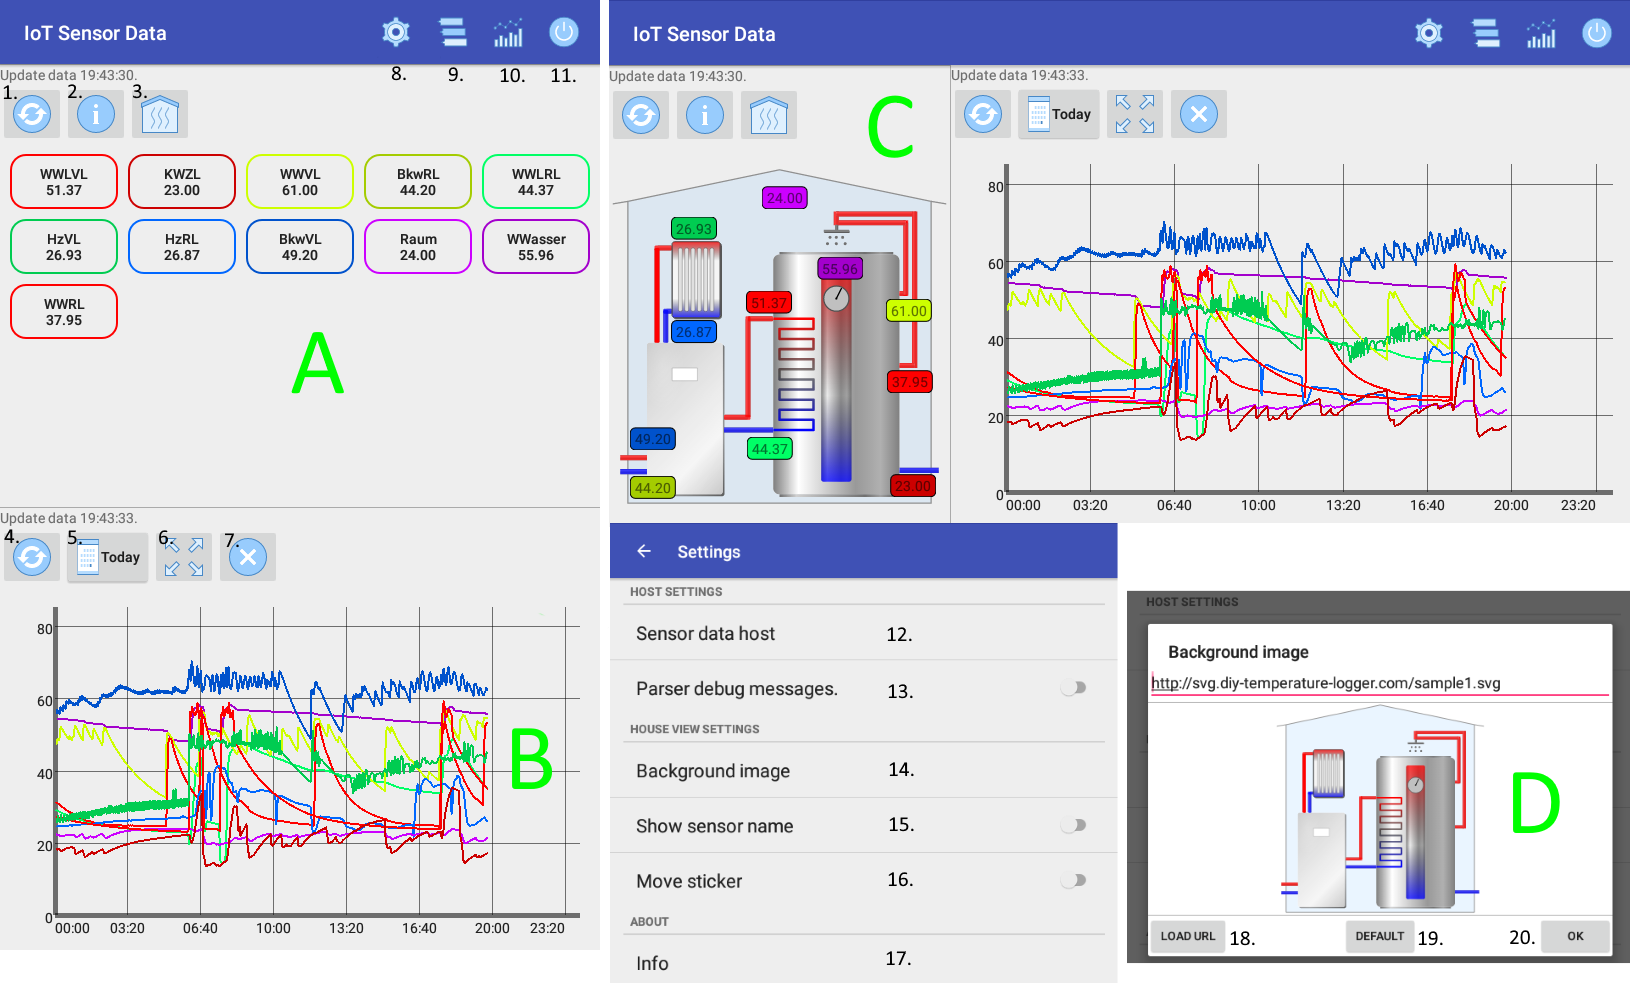
A – Sensor View
Here, the current values of the sensors DS18B20 or other sensors are shown. Clicking 1. to update the actual data. With the item 2. a more detailed view is shown. The error rate and the internal name of the sensors can then be seen. With the click to 3. the switches to the Haus View. By clicking on the sensors, graphs are turned on and off in view B.
B – Chart View
Here, the temperature progression of the sensors is shown. Click item 4. to queried the values from the ESP Board. At 5. The date of the query can be set. It can be zoomed in the timeline to see only part of the day, the Y axis is automatically calculated. Button 6. switch to minimal zoom. Button 7. deletes all graphs in the app. A total of 10 different colours are used to assign the sensors in view A to temperature progression.
C – House View
Here you can see the sensors with an SVG wallpaper. By clicking on the sensors, the graphs in view B are turned on and off. If option 16. Move stickers can be moved and repositioned on the wallpaper. With option 14. Background Image can be changed.
D – Load SVG View
An other SVG can be imported here. By clicking on Button 18. the image is loaded and displayed from the URL. The button 19. restores the original SVG. With the button 20. the changes will be adopted.
Application
At 9. and 10. the Sensor View (A) and Chart View (B) can be turned on and off. The Button 11. exits the program. With item 8. the settings can be changed. Configure the host that provides the data (the ESP board) with item 12. If option 13. is enabled, then parsing information are presented in a message box. This is useful to show parsing informations and parsing errors if a web server other than the ESP board is used. If option 15. is enabled the name of the sensor in addition to the temperature is also displayed in the House View. Option 17. shows information about the version, license and libraries used.
Download
For testing, there is a free version of IoT Sensor Data. The host cannot be adjusted. It can only access the simulation on the Internet. (https://simu.diy-temperature-logger.com)
![]()
The correct version can be downloaded here.
![]()
SVG Download/Description
Self-created SVGs can be used with the app. SVGs are vector-based graphics that can also be generated with a text editor. The description is similar to html. Here are a few examples that can be imported into IoT Sensor Data. The SVGs are created by me and can be downloaded, edited and used freely. Sample2.svg is included in the app as the wallpaper by default. Sample1.svg is basically the same graph with fewer 3D effects.
| https://svg.diy-temperature-logger.com/sample1.svg |
 |
| https://svg.diy-temperature-logger.com/sample2.svg |
 |
| https://svg.diy-temperature-logger.com/simple1.svg |
 |
This is for example the file simple1.svg.
<svg width="270px" height="270px" version="1.1" xmlns="https://www.w3.org/2000/svg">
<!-- house -->
<g transform="translate(3 3)" >
    <path style=" fill:#98CCFD;" d="M 12 25 V264 H252 V25 L 132 0 L 12 25" stroke="black" stroke-width="1" stroke-linecap="butt" fill-opacity="0.2"/>
    <line x1="0" y1="27" x2="12" y2="25" stroke="black" stroke-width="1" stroke-linecap="butt"/>
    <line x1="264" y1="27" x2="252" y2="25" stroke="black" stroke-width="1" stroke-linecap="butt"/>
</g>
</svg>
Interface: App Request – Webserver Response
The application uses two requests to query current and recorded values from a http web server. This also allows your own sensor logging projects with Arduino and Raspberry Pi to be used with the app.
| App Request | Webserver Response |
|---|---|
| aktuelle Daten https://<server>/config |
<InterfaceVersion=1>;<DeviceName>;<VersionString>;<LastStartTimeBoard>;<TemperatureMeasureCount> <Scale (1-Left,2-Right>;<UniqueName>;<Temperatur>;<SensorName>;<CRCError1>;<CRCError2>,<CompleteError> <Scale (1-Left,2-Right>;<UniqueName>;<Temperatur>;<SensorName>;<CRCError1>;<CRCError2>,<CompleteError> … |
| z.B. http://simu.diy-temperature-logger.com/config |
1;esp-simulation;0.9;2018/11/20 11:46:23;33 1;721E;53.37;WWLVL;7;0;0;977 1;E4F6;23.27;KWZL;12;2;0;845 … |
| gespeicherte Daten https://<server>/file?y=<yyyy>&m=<mm>&d=<dd>&id=<SensorId> |
<hh:mm>;<Number> … |
| z.B. http://simu.diy-temperature-logger.com/file?y=2018&m=12&d=09&id=5364 |
00:00;12.34 00:04;34 01:32;44.11 … |
The server https://simu.diy-temperature-logger.com/ is also used as web server in the demo version of IoT Sensor Data.
Example of an Arduino Server implementation:
  server.on("/config" , HTTP_GET, [](AsyncWebServerRequest * request)
  {
    Serial.printf("/config\n");
    String stringReturn = sensor18b20::GetInstance().getWebAppConfigText();
    request->send(200, "text/plain", &stringReturn[0]);
  });

  server.on("/file" , HTTP_GET, [](AsyncWebServerRequest * request)
  {
    int paramsNr = request->params();
    DateTime dt(MyNTPClient::GetInstance().getEpochTime());
    unsigned long start = millis();

    int year = dt.year();
    int month = dt.month();
    int day = dt.day();
    sensor18b20& sensorInstance = sensor18b20::GetInstance();
    String id = "";
    if( sensorInstance.getNumberSensorCnt() > 0)
    {
      id = sensorInstance.getSensorCRC16Id(0);
    }

    for(int i=0;i<paramsNr;i++)
    {
      AsyncWebParameter* p = request->getParam(i);

      if(p->name() == "y")
      {
        year = p->value().toInt();
      }
      else if(p->name() == "m")
      {
        month = p->value().toInt();
      }
      else if(p->name() == "d")
      {
        day = p->value().toInt();
      }
      else if(p->name() == "id")
      {
        id = p->value();
      }
    }
    Serial.printf("/file '%s'\n", &id[0]);

    // close file in callback readTempDataFromSD
    AsyncWebServerResponse *response = request->beginResponse(String("text/plain"), g_fileTempData.size(), readTempDataFromSD);
    response->addHeader("Server", "MyServerString");
    request->send(response);
  });
License
Copyright is up to me. It is not allowed to pass IoT Sensor Data to others.
Libraries
IoT Sensor Data uses the following libraries under the Apache 2.0 license.
GraphView – https://github.com/jjoe64/GraphView/wiki
Volley – https://github.com/google/volley/blob/master/LICENSE
AndroidSVG – https://bigbadaboom.github.io/androidsvg/index.html
Support: preference-v7 – https://developer.android.com/topic/libraries/support-library/packages